California Proposition 13
Background
Prop 13 was established in California in 1978 with the intention to protect homeowners from paying too high of property taxes as statewide home values increased at a rapid rate.
The law created a base year value for home, a restricted rate of increase of no greater than 2% a year, and a limit on property taxes to 1% of the assessed value (plus any local additional taxes)
As a result property taxes increase at the Consumer Price Index each year, while home values, especially in San Francisco, increase at a rate closer to 6% a year. In San Francisco the current property tax rate is 1.18%
Research Questions
- What does the impact of prop 13 look like in San Francisco?
- How do market rate housing costs, years of occupancy, and property taxes interplay?
- Does prop 13 deepen inequality by further subsidizing wealth accumulation for homeowners? Especially multi-generational wealth?
- Does prop 13 challenge local governments’ ability to have accurate home value data?
Analysis by Neighborhood
This chart shows Zillow’s Market Rate Estimate of the “Typical Home Value” by neighborhood in San Francisco by month from 2000 to 2022. This helps us see the large discrepancy across neighborhoods in the city.
This chart uses data from the San Francisco Assessor’s Office to show the assessed home value averaged by neighborhood from 2007 to 2019. This helps show how the values increase at the consumer price index instead of market rates. We again see a large discrepancy across neighborhoods.
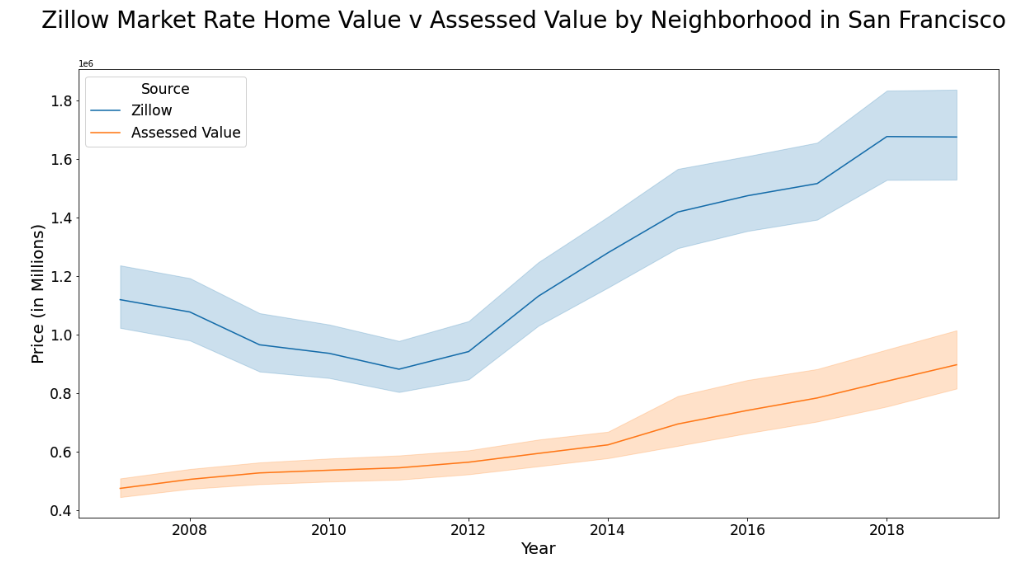 This chart combines the two charts above to show the difference by neighborhood between market rate and assessed home value. This is our best attempt to generate a “tax subsidy” based on Prop 13.
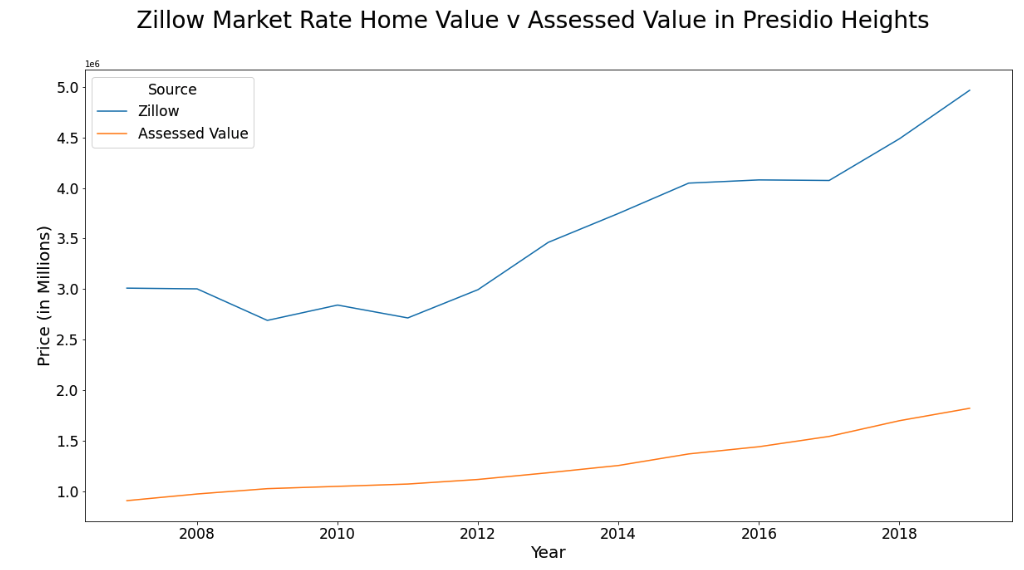 Some neighborhoods benefit more than others from this tax subsidy. Presidio Heights is the most egregious example of this due to the combination of high home values, averaging 4.9 million in 2019, and long term homeownership making average assessed home values in 2019 only $1.8 million. This creates an average subsidy in Presidio Heights of $3.1 million in 2019.
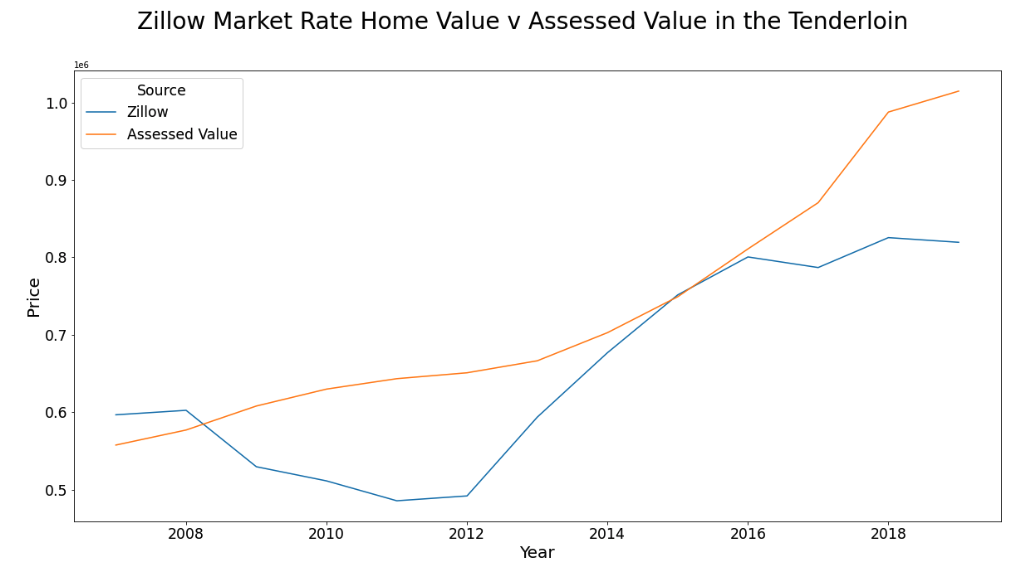 Meanwhile the Tenderloin experienced a very different experience in this same time in which the assessed value tended to be higher than the Zillow estimate home value. In the Tenderloin the home value estimate in 2019 averaged $819,000, while the assessed value was an average of $1 million, somehow creating a negative average subsidy!
Here the tax subsidy by neighborhood shows that some neighborhoods benefit disproportionately more than others, with Presidio Heights and Cow Hollow way above all other neighborhoods in the city.
Analysis by Blockgroup
The assessor’s office values can be summarized at the blockgroup level to compare with American Community Survey home value estimates.
This chart shows the assessed values average by blockgroup across the city. High values are concentrated in the northern part of the city and low values are concentrated in the southeast part of the city.
This chart shows the American Community Survey 2019 home value estimates (as reported by home owners in owner occupied housing). A similar distribution trend occurs as above, but with overall higher values as these better represent market rates.
Note how many blockgroups are at 2+ million - the ACS dataset does not record values over two million, creating an artificially low value for blockgroups in an expensive housing market like San Francisco.
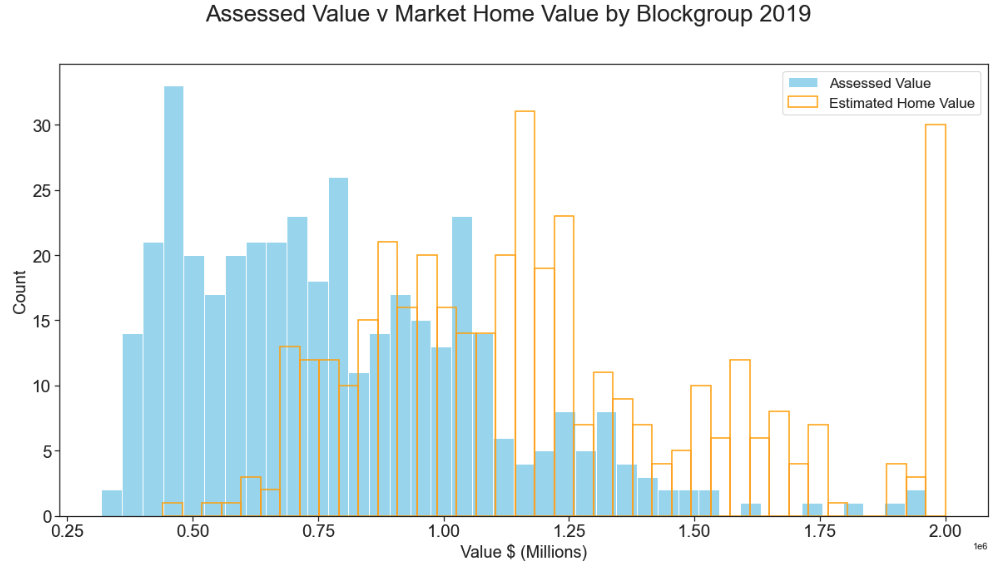 Here we see a comparison of assessed value and ACS market rate home values. This shows the difference and again gets at that tax subsidy amount. Note that the ACS data caps out at 2 million, which explains why so many blockgroups have that value.
Subtracting the assessed value from the market rate value creates the “tax subsidy” provided by Prop 13, which is the amount of home value that property taxes are not being paid for. The tax subsidy should increase as values increase, but the below regressions actually show an inverse relationship between subsidy and assessed value.
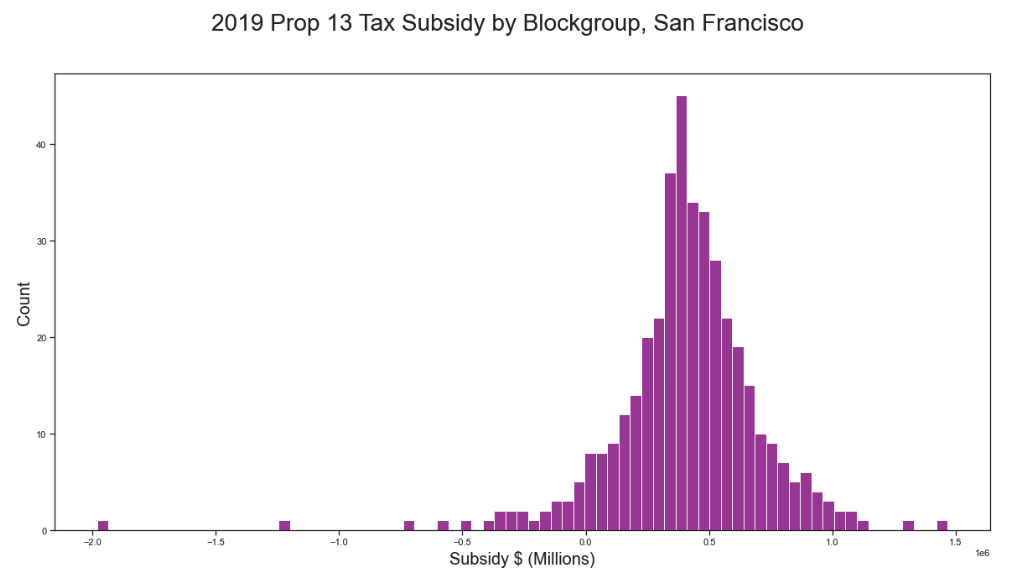 This chart shows the distribution of tax subsidy across blockgroups. The mean is $400,000, max is 1.5 million, and the minimum is -$2.0 million. With negative values removed the mean becomes $450,000.
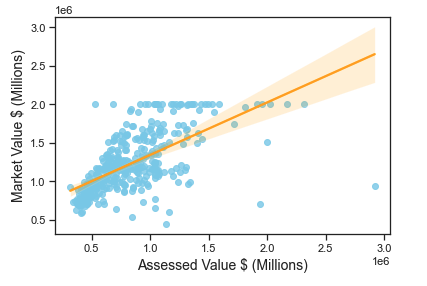
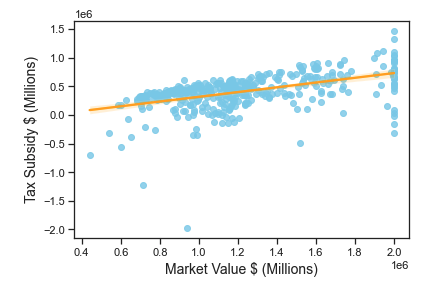
The market value and the subsidy have a positive correlation with an increase of .3 million in market value for every 1 million increase in assessed value (with an adjusted R-squared of .7). This aligns with the relationship between market value and assessed value, which sees an increase of .6 million in market value for every 1 million increase in assessed value (adj R-squared .9).
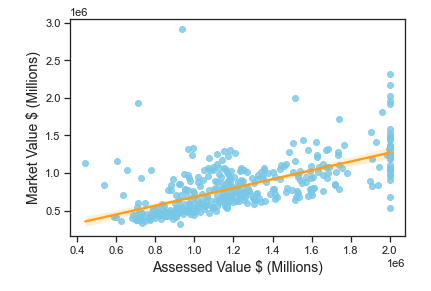
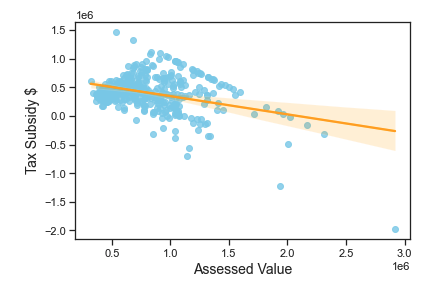
The assessed value, however, has a negative correlation with the tax subsidy, indicating that as the assessed value increases the tax subsidy decreases. Surprising. The regression shows us that for every 1 million increase in tax subsidy the assessed value increases .4 million, which does not align with our line of regression plotted here (adj R-squared .4). For every 1 million the market value increases, the assessed value increases 1.4 million (adj R-squared .9).
Data Sources
- SF Assessor’s Office Property Tax Roll: GEOJSON - points (2.3 million)
- Zillow Home Value Index: CSV - by neighborhood
- SF Realtor Neighborhoods: GEOJSON - polygons
- ACS MEDIAN VALUE DOLLARS (Table B25077): CSV - by blockgroup